
About memy stats
Information About me
Impossible to map the world–we select and make graphics so that we can
understand it
-Roger Tomlinson.
My ideal work: a map, a computer and some research.
4
Projects
Completed
4
Years of
experience
5
Happy
Clients
4
Customer
reviews
My Skills
My Timeline
2014 - 2019
University - B.A Geography and Environmental Studies
Degree.
2018 - 2018
Intern - ESRI EA
Intern
2019 - 2021
Cartographer - BIST LLC
Cartographer.
2019 - 2019
Enumerator - Kenya National Bureau of Statistics
Collected and uploaded of 100+ household data to KNBS servers
2019 - 2019
GIS and Data Collection - Epsilon Generation
Mapped over 150 real estate properties in London; listed barriers to development of 120+ Italian land parcels. Data was used to advise real estate prospectors in London and Italy on most profitable residential sites. Deadlines were met in over 90% of the assignments until closure.
2019 - 2019
Map Digitization - Cropio
Extracted farm plots in Sentinel 2-images and other GIS processing tasks to improve machine learning for the CROPIO crop growth algorithms.
2020 - 2022
GIS and Environmental Researcher - Climate and Energy Advisory
Used various GIS tools, such as R and Qgis to create maps for various proposals. As the environmental researcher, applied my geographical knowledge in writing reports for various projects the company had been contracted to undertake.
2022 - 2023
GIS Technical writer - Life in GIS
Blogged on how to leverage various tools, more so programming to conduct various geospatial and remote sensing exercises.
2023 - 2023
GIS Specialist and Cartographer - Consultancy
Through a mutual colleague, designed for a local government the climate vulnerability and resource maps for the county and also disaggregated to local administrative units.
2023 - 2023
GIS Specialist & Remote Sensing Specialist - HydroIntel Consultancy
Performed raster processing to normalize the bathymetric pixel values of Rwandese lakes which were retrieved from GloBathy to more realistic values. Also used pythonic algorithms to automate feature selection.
2023 - 2023
Remote Sensing Machine Learning Scientist - GeoPsy
Used ML algorithms to perform landcover classification of Griffith University-Logan campus arboretum. Also explored use of DeepForest and Detectree deep learning algorithms for tree detection and estimation of total number of trees in the arboretum. Also extracted various vegetation indices. Supervisor - Dr. Francis Oloo
2024 - to date
Junior Data Scientist - Natural State
Every week, ensured all the data pipelines were successfully run. Additionally, I created data visualizations monitoring the incoming data from the images and audio files uploaded by the field team. Finally, I employed python and SQL to convert datasets, say from csv to sqlite and also in filtering data.
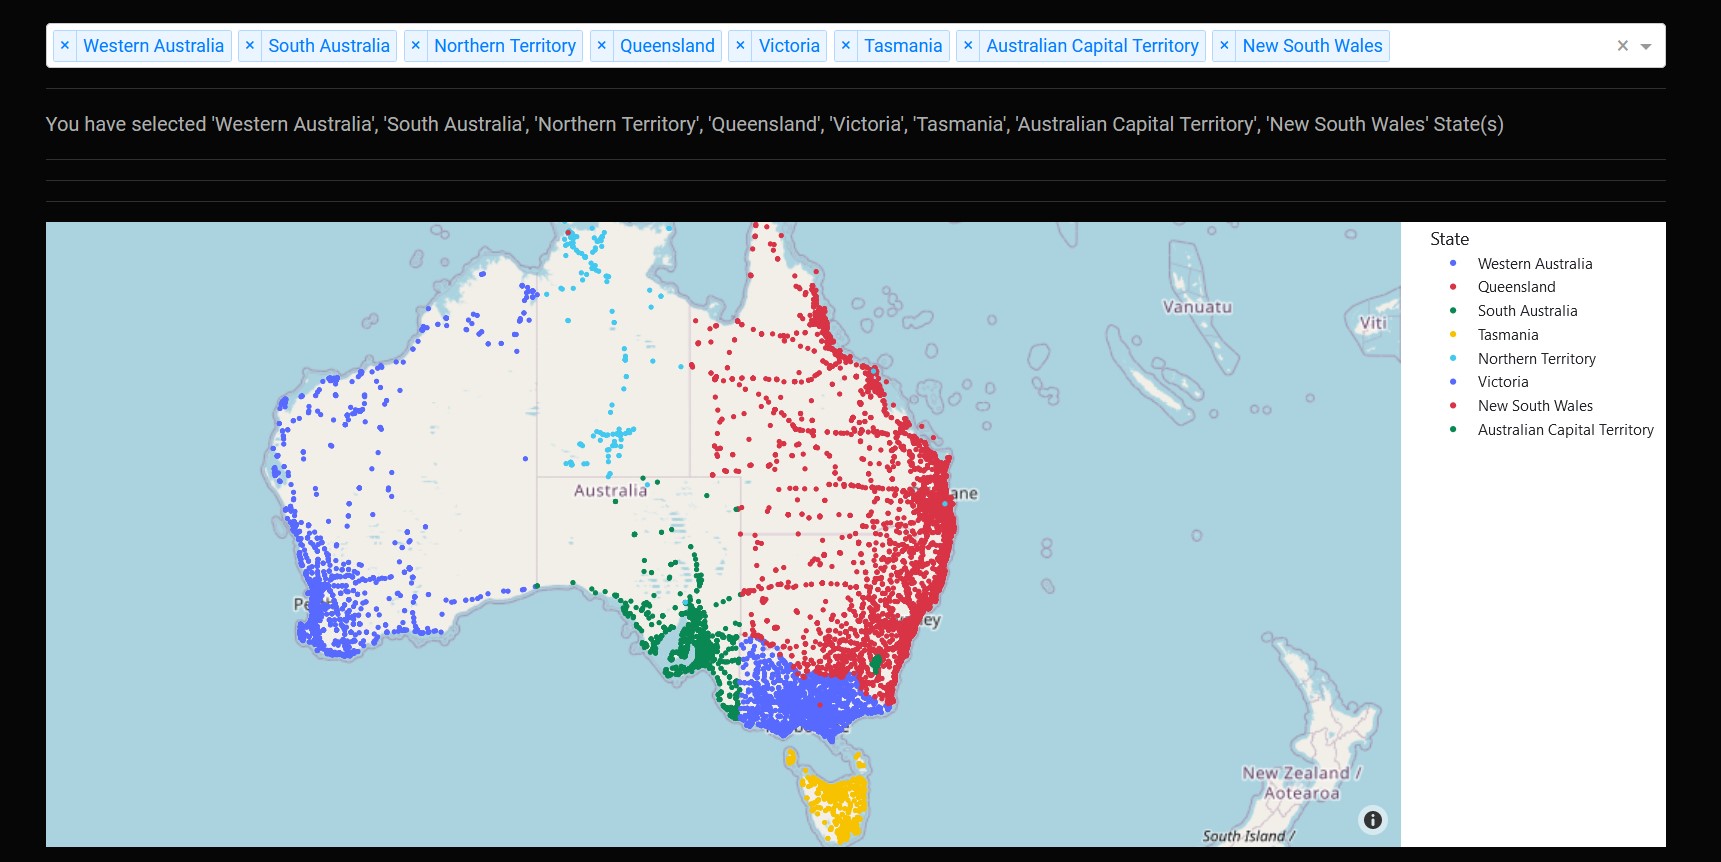
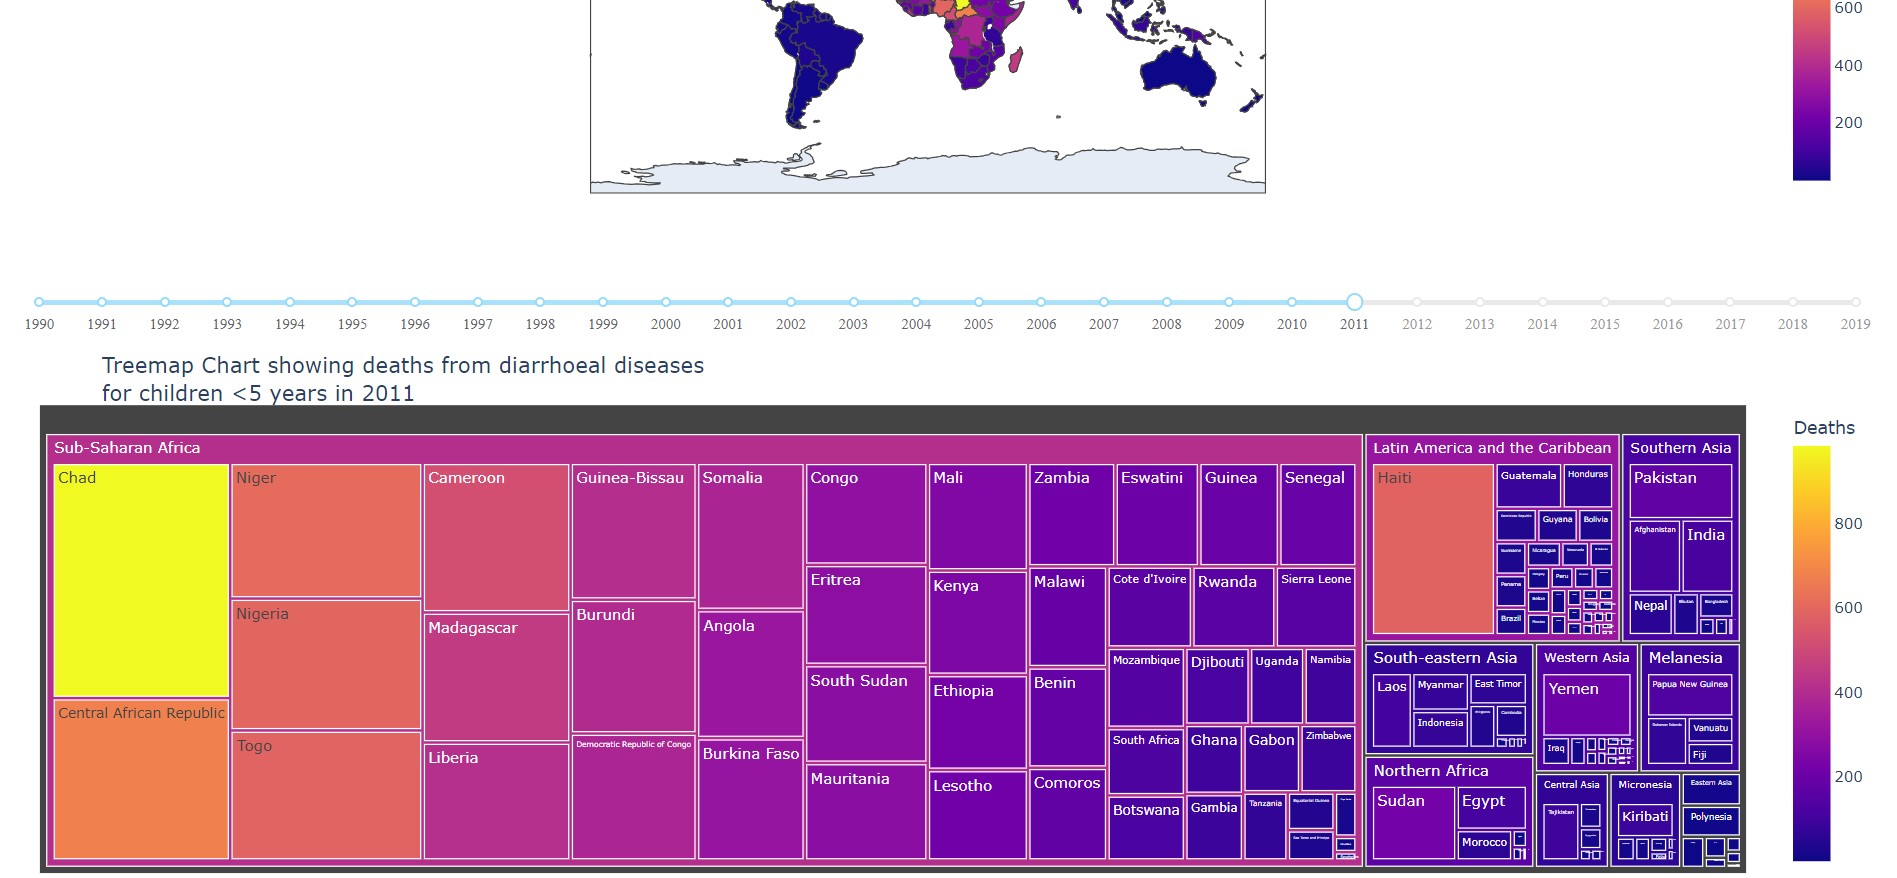
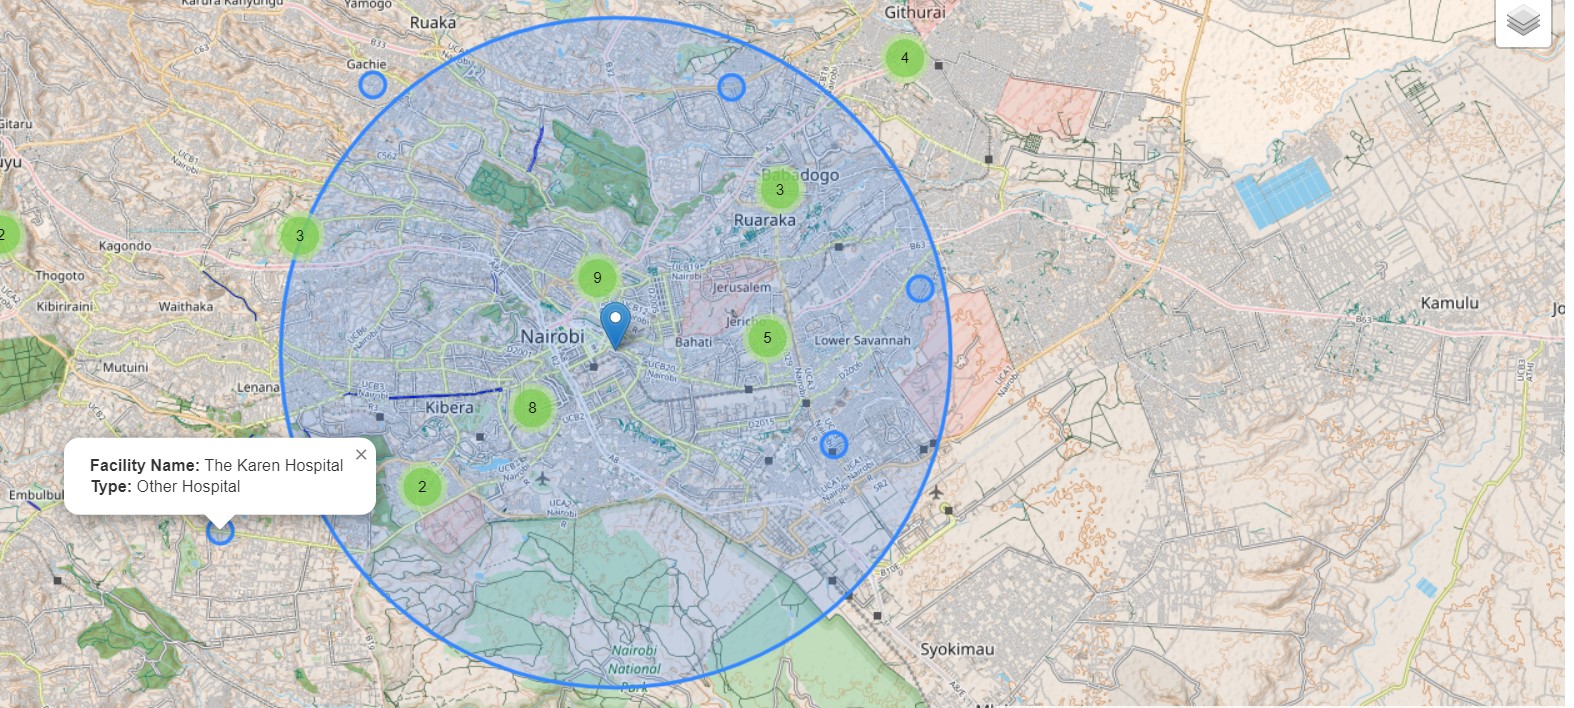
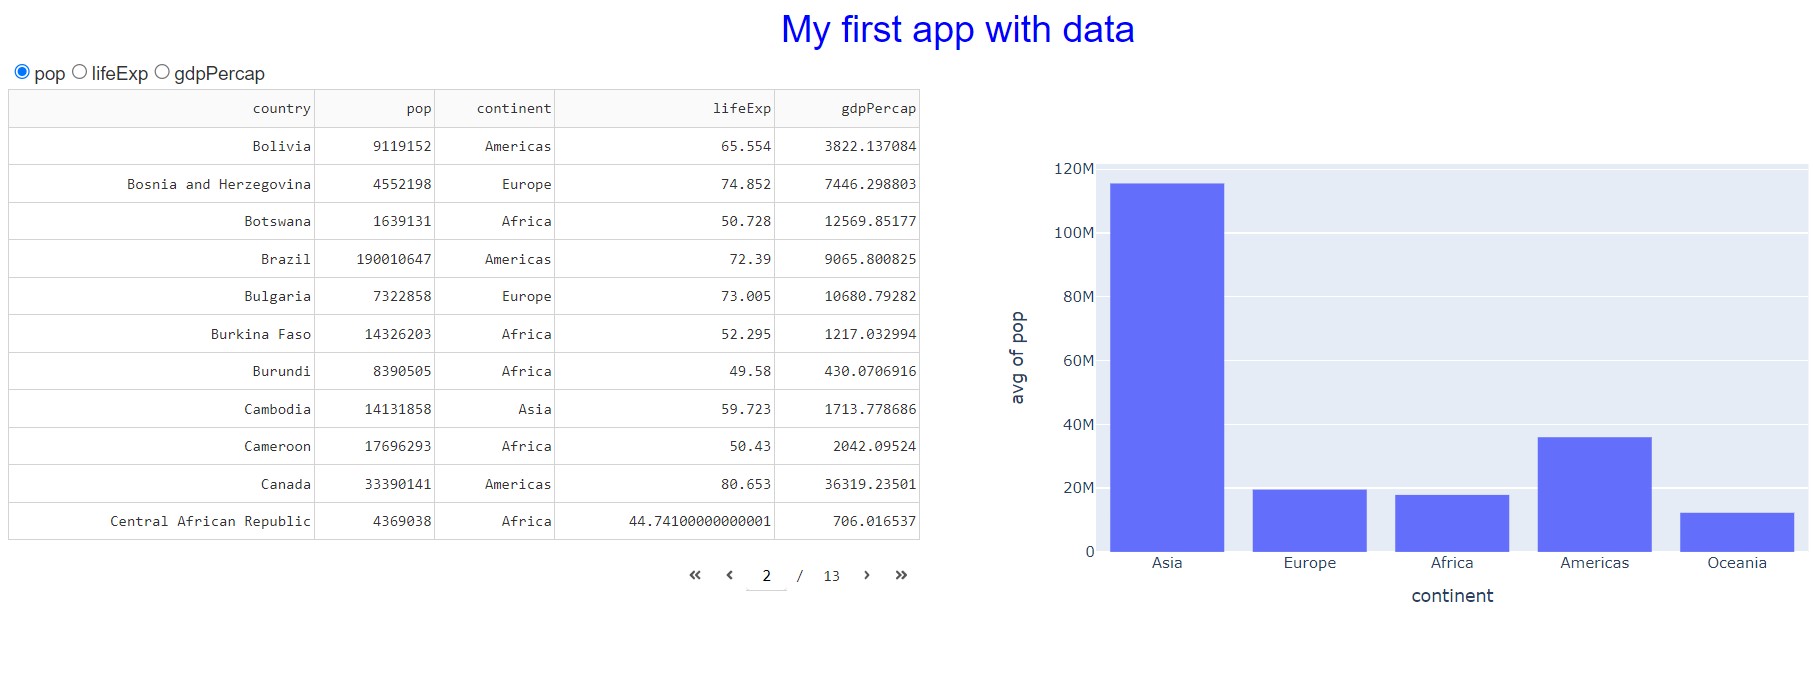
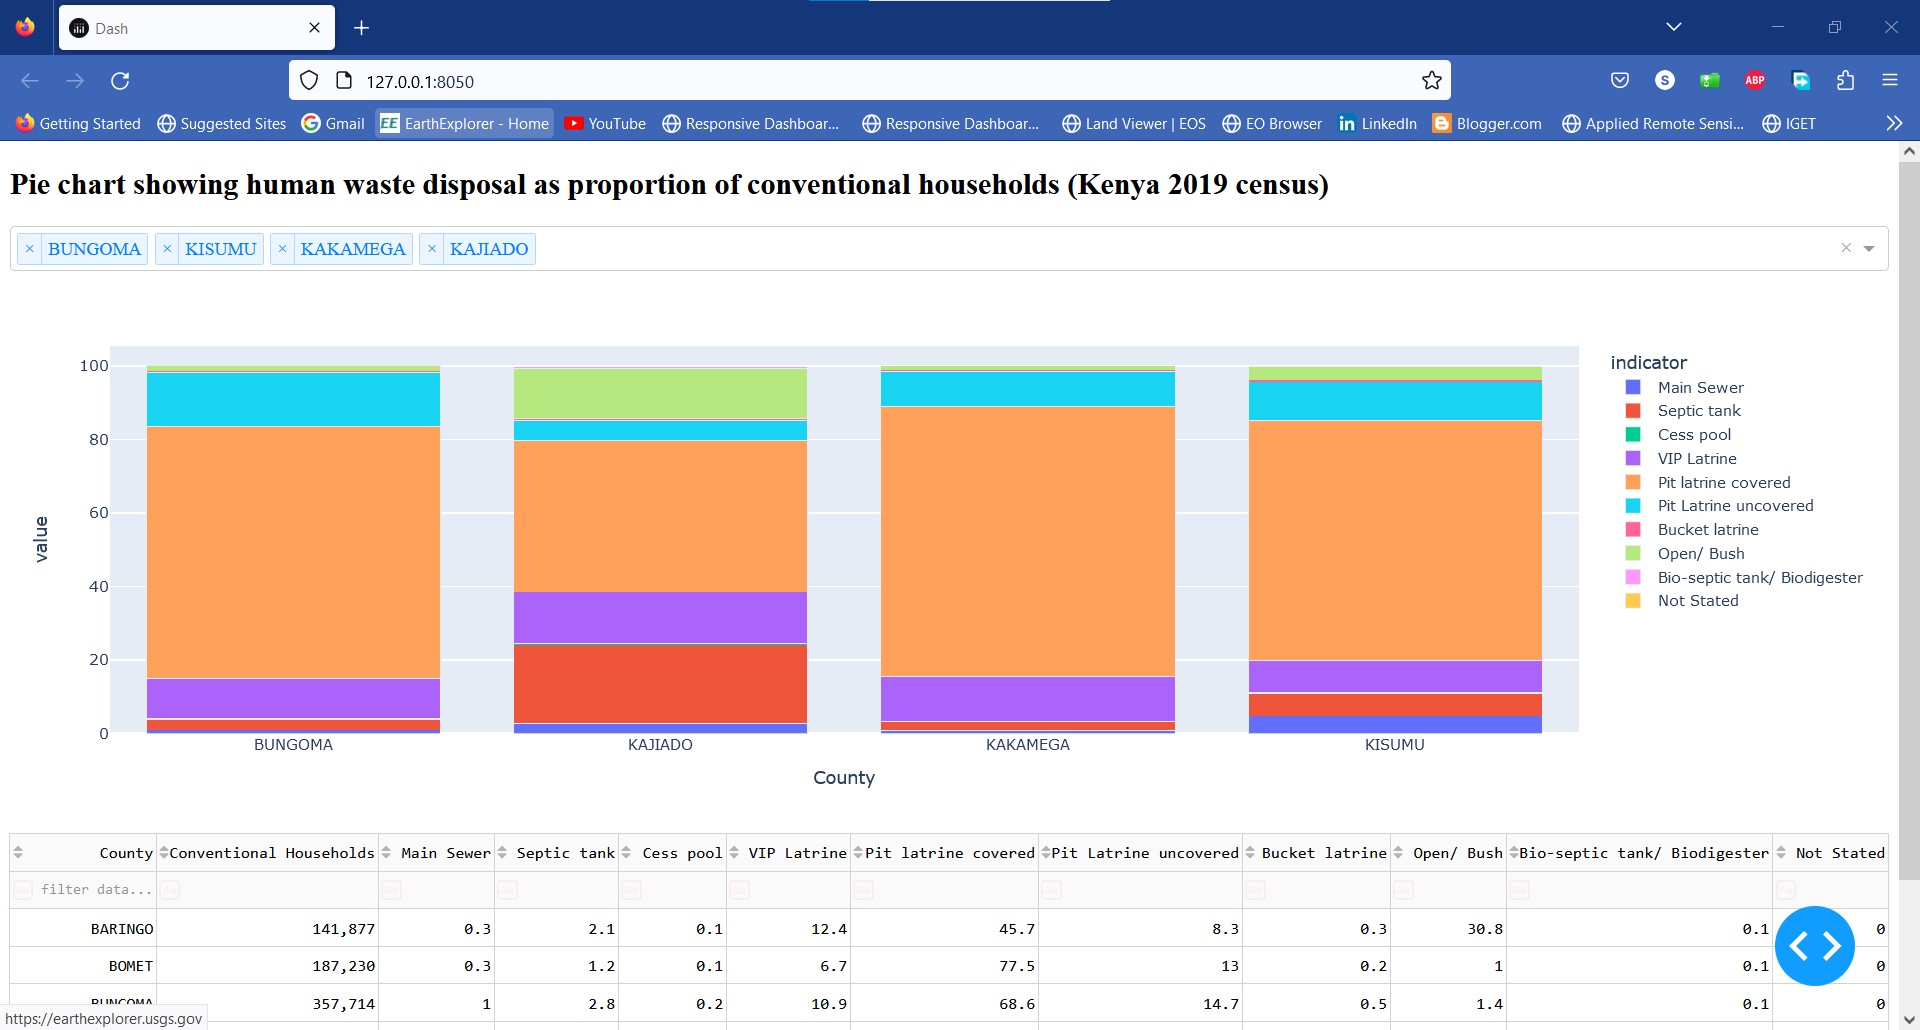
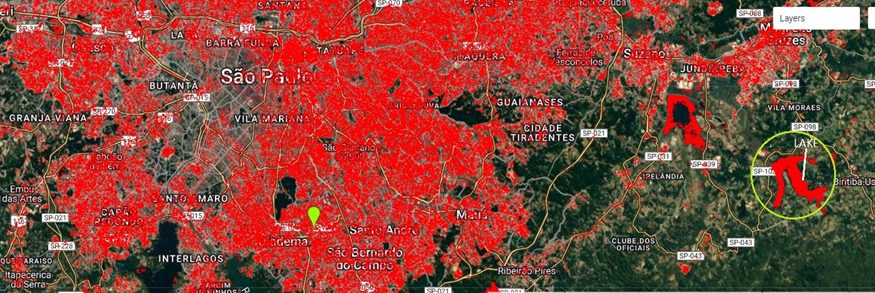
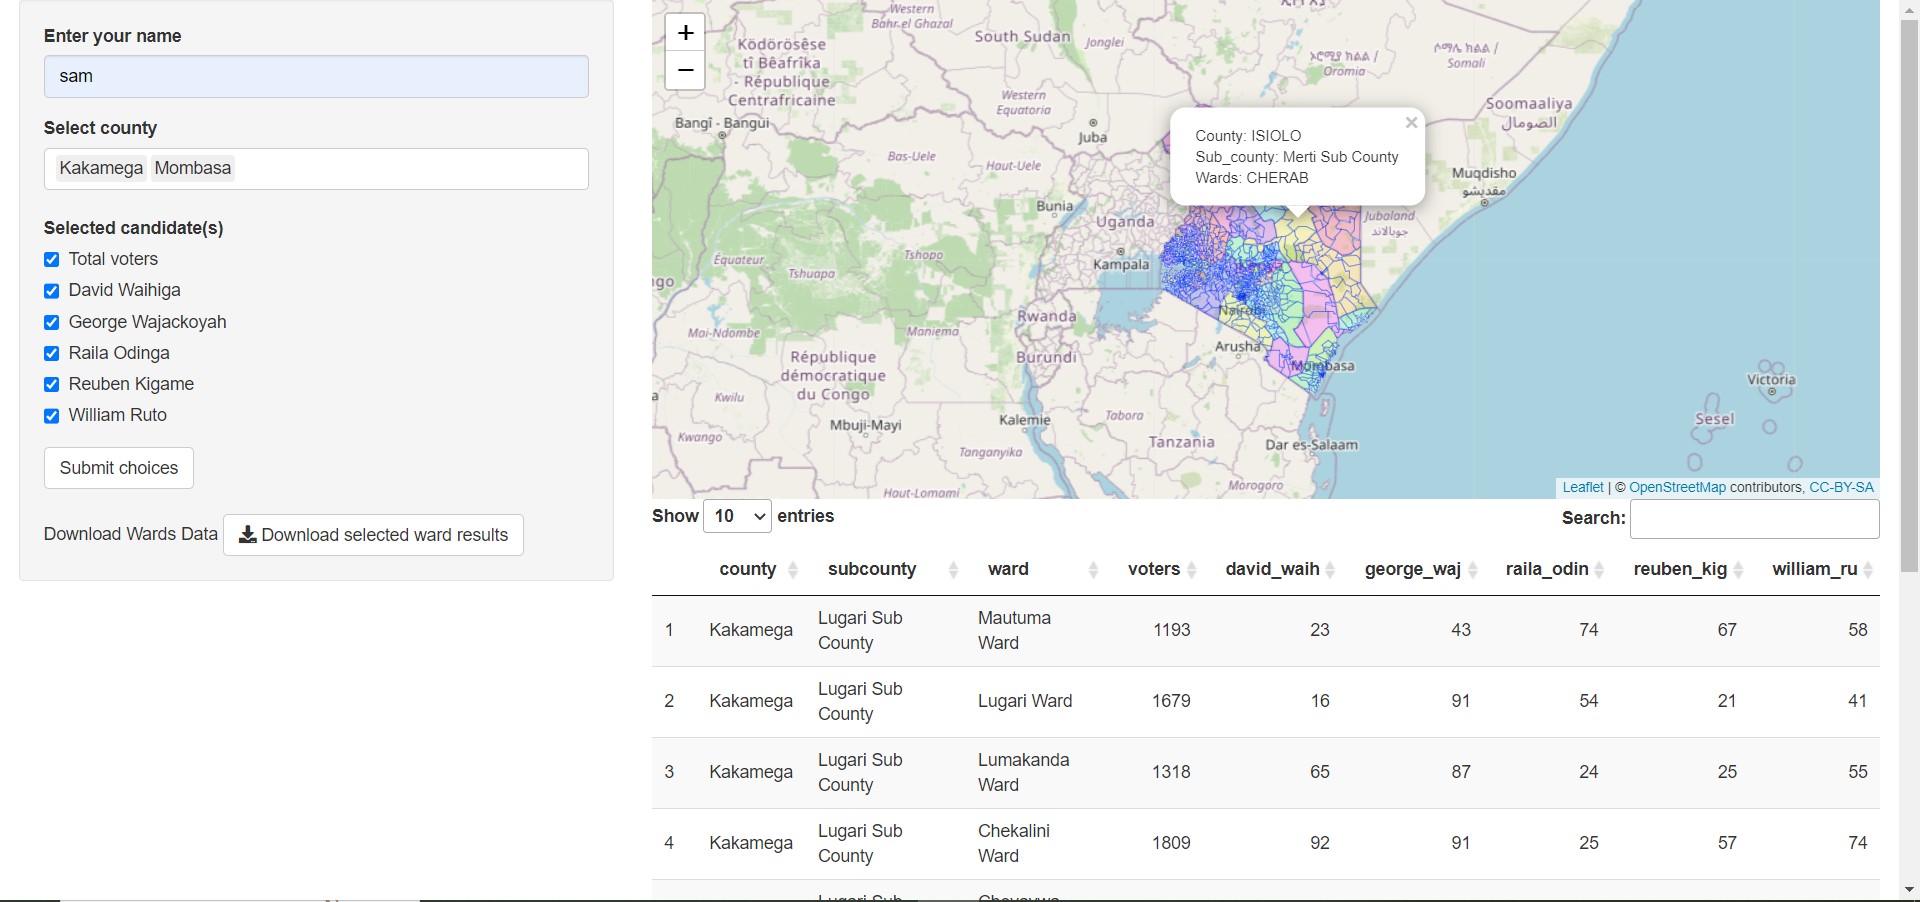
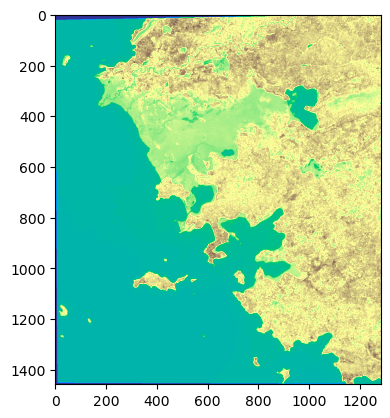
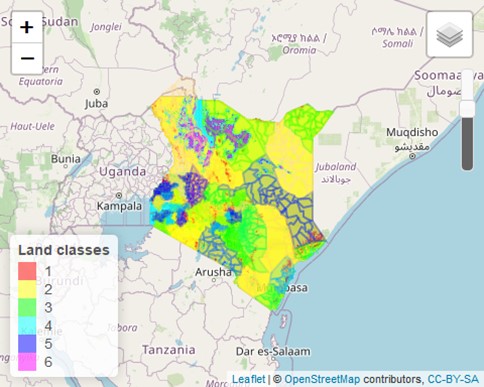
My PortfolioMy Work
Here is a sample of my work.
Better seen than said.


My PublicationsMy Blogs

Leaflet in Practice: Create webmaps using the JavaScript Leaflet library
This is a guide book to assist the beginner in creating interactive webmaps using the JavaScript based Leaflet library.

A Beginner Friendly Introduction to GIS Operations in R: A practical guide
A tutorial for beginners in doing geospatial operations in R.

Basic Raster and Vector Operations in Qgis: A tutorial
Learn Qgis in an intuitive manner!

A Spatial-temporal Analysis of Land Cover Change in the Ngong Hills Area, Kajiado County
Check out my undergraduate project paper.
Contact MeContact
Contact me here
Nobody wants spam. If you have something serious, do let me know.
: Global citizen.
: sammigachuhi@outlook.com
: University of Nairobi, Africa Nazarene University, many others
: +254xxxxxxxxx
: English, Kiswahili